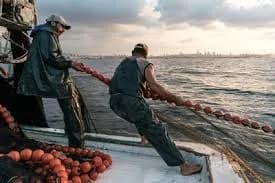
A new report revives hopes for fisheries in the Mediterranean Sea and the Black Sea.
There is a need to reduce bycatch and discards and provide more support to small-scale fishers
The main commercial fish species in the Mediterranean and the Black Sea are still suffering from overfishing, although this problem has become less severe in recent years.
11 December 2018, Rome – A report released today by the General Fisheries Commission for the Mediterranean (GFCM) of the Food and Agriculture Organization of the United Nations (FAO) stated that although the main commercial fish species in the Mediterranean and the Black Sea are still overfished, the situation has become less severe in recent years. This development has revived hopes — for the first time — for the recovery of fish stocks.
The share of overexploited fish stocks declined by 10 percent, from 88 percent in 2014 to 78 percent in 2016. However, the report on the State of Mediterranean and Black Sea Fisheries warns that more efforts are needed to ensure the long-term sustainability of fish stocks.
This requires more support for the small-scale fishing sector, which employs most fishers and causes less environmental damage. It also requires reducing bycatch and discards and introducing stronger measures such as significantly limiting fishing or establishing restricted fishing areas (areas where fishing activities are regulated).
The latter measure is particularly needed to protect the most heavily fished species, such as European hake, which is currently caught at about six times the sustainable level.
Abdellah Srour, Executive Secretary of the General Fisheries Commission for the Mediterranean, said: “Fishery resources provide an important social and economic balance for the region and are essential for ending hunger and poverty.”
Miguel Bernal, FAO fisheries officer and one of the coordinators of the report, said: “Sustainability may be costly in the short term, but nothing is more costly than running out of fish.”
Mediterranean and Black Sea fisheries face long-term threats from increasing pollution caused by human activities, habitat degradation, the introduction of non-native species, overfishing, and the impacts of climate change.
Most Overfished Species
European hake remains the most overfished species across the entire Mediterranean, followed by turbot in the Black Sea and mackerel in the Mediterranean.
Fish species that are harvested within biologically sustainable limits include small pelagic species (such as sardines and anchovies), as well as some stocks of red mullet and deep-water shrimp.
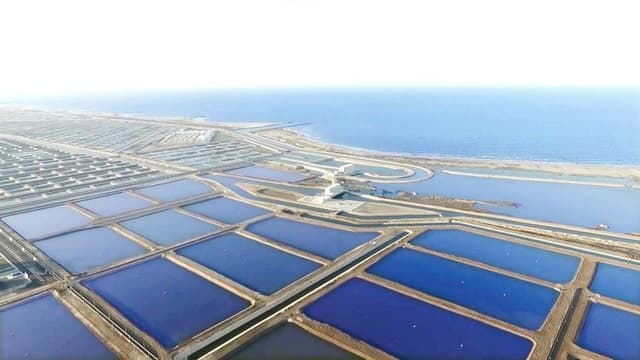
Egypt’s fish production has increased to 2 million tons, with a self-sufficiency rate of 95%.
Dr. Salah Moselhy, Chairman of the General Authority for Fish Resources Development, confirmed the increase in Egypt’s domestic fish production to nearly 2 million tons. In statements to “Youm7,” he explained that fish production from aquaculture reached 1.7 million tons, while the remainder of local fish production comes from natural fisheries (lakes, the two seas, and the Nile). He added that Egypt’s self-sufficiency rate in fish has exceeded 95%.
The Chairman of the Authority stated that fish resource development is being carried out through several key pillars. The first focuses on the development and rehabilitation of lakes (Manzala, Burullus, Mariout, and Bardawil). The second pillar is expanding aquaculture through national projects such as (Berket Ghalioun, the Deba Triangle, East Port Said, and the Suez Canal Company). The third pillar involves developing hatcheries to produce fry, especially marine fry. The fourth pillar focuses on expanding integrated aquaculture, particularly with the increase in reclaimed lands and reliance on well water.
Moselhy added that there is a plan to increase fish production by converting traditional farming systems into intensive and semi-intensive systems, expanding integrated aquaculture in desert reclamation areas, using well water, recycling water, and maximizing returns per unit of water by first using it for fish farming and then for irrigating crops. The plan also includes expanding marine fish cages and crustacean farming, especially shrimp, upgrading and improving production sites affiliated with the Authority to boost productivity, and expanding marine cage aquaculture. Approval has been granted to offer 21 marine cage sites to investors, including 9 in the Red Sea and 12 in the Mediterranean Sea.
A report by the General Authority for Fish Resources Development, affiliated with the Ministry of Agriculture, confirmed that the development and rehabilitation of the lakes (Manzala, Burullus, Mariout, and Bardawil) is a national project sponsored by the President of the Republic and implemented in coordination with the Engineering Authority of the Armed Forces in cooperation with the General Authority for Fish Resources Development. Development phases for these and other lakes are ongoing.
Water Resources Cooperatives Law
Law No. 123 of 1983
Promulgating the Aquatic Resources Cooperatives Law
In the Name of the People
President of the Republic
The People's Assembly has enacted the following law, which we hereby promulgate:
Article (1)
The provisions of the attached law shall apply to aquatic resources cooperative societies.
The provisions of the general regulations, organizational decisions, and internal bylaws in force concerning these cooperative societies on the date of entry into force of this law shall continue to apply insofar as they do not conflict with its provisions, until the implementing regulations, decisions, and internal bylaws are issued in accordance with the provisions of this law.
Available aquatic resources cooperative societies at the time of entry into force of this law must amend their status and bylaws and re-register in accordance with its provisions within one year from the date of issuance of the implementing regulations for this law. Otherwise, they shall be dissolved by a decision of the competent administrative authority.
The implementing regulations shall specify the procedures for re-registration.
Article (2)
The existing boards of directors of aquatic resource cooperative societies at the time this law comes into effect shall continue to perform their duties until new boards are formed in accordance with its provisions, within a maximum period of three months from the date of re-registration of these societies.
Article (3)
The Fishermen's Cooperative Support Fund, established by Presidential Decree No. 444 of 1961, shall be used to exercise its powers in accordance with the provisions of the attached law.
Article (4)
The General Authority for Fish Resources Development shall be the administrative body responsible for implementing the provisions of this law, and this Authority shall be affiliated with the Minister of Agriculture.
Article (5)
The Minister of Agriculture shall issue the executive regulations for this law, based on a proposal from the General Authority for Fish Resources Development, within a maximum period of six months from the date this law comes into effect.
Fish Resources Development
Mr. El-Sayed El-Quseir, Minister of Agriculture and Land Reclamation, held a meeting with senior officials of the Ministry concerned with livestock, fisheries, and poultry sectors, in the presence of Eng. Mostafa El-Sayad, Deputy Minister of Agriculture.
The meeting reviewed the State’s efforts in developing the livestock, poultry, and fishery sectors, as well as the development and rehabilitation of lakes and the expansion of aquaculture, in line with the directives of His Excellency President Abdel Fattah El-Sisi, President of the Republic, to achieve food security for citizens in meat, poultry, fish, milk, and their products.
El-Quseir directed that work be expedited to complete the fish hatcheries currently under development and construction in the lakes, as well as marine cages, and to offer them for investment. He also emphasized accelerating the development of the fish feed system.
He further instructed the swift completion of a comprehensive database for fishermen at Lake Nasser, with the aim of integrating them into social and health protection programs and disbursing their entitlements during the fishing ban period.
The meeting also discussed cooperation with African countries in the field of fisheries and marine cages through a clear and well-defined vision.
In addition, the meeting addressed the latest developments and progress in efforts to develop the livestock and poultry sectors, the veal project, milk collection centers, and the advancement of the animal feed industry system in all its aspects.
Signing of a Memorandum of Understanding between the National Company for Fish Resources and Tanzania."
Within the framework of the General Command of the Armed Forces’ keenness to strengthen ties of cooperation with brotherly African countries in all fields, a Memorandum of Understanding (MoU) was signed between the National Company for Fish Resources and Aquatic Life, one of the companies affiliated with the National Service Projects Organization, and the Ministry of Livestock and Fisheries of the United Republic of Tanzania.
The signing was attended by Major General / Engineer Medhat El-Nahas, Assistant Minister of Defense, Major General / Walid Hussein Abu El-Magd, Director General of the National Service Projects Organization, and the Tanzanian Minister of Livestock and Fisheries.
The MoU aims to enhance joint cooperation in marine and freshwater aquaculture and to benefit from the expertise and infrastructure possessed by the National Service Projects Organization.
Major General / Engineer Medhat El-Nahas delivered a speech conveying the greetings and appreciation of Field Marshal / Mohamed Zaki, Commander-in-Chief of the Armed Forces and Minister of Defense and Military Production, and General / Osama Askar, Chief of Staff of the Armed Forces, to the attendees. He affirmed Egypt’s pride in its strong relations with its African brothers and the General Command of the Armed Forces’ commitment to further strengthening cooperation and partnership in various military and economic fields.
The Lake Protection and Fishery Development Authority continues fishing operations at various production sites under its management across the country
The Lake Protection and Fishery Development Authority has continued fishing operations at various production sites under its management across the country, driven by its commitment to support the fish farming sector, which is considered one of the most important sectors playing a crucial role in achieving food security and providing employment opportunities for young people.
The Authority announced the continuation of fishing activities this year in several fish farms under its management nationwide throughout the week. At the Manzala Fish Farm in Dakahlia Governorate, fishing operations continued, producing 28 tons of tilapia, mullet, and catfish from two fish ponds covering an area of 7 feddans, in the presence of Dr. Mohamed Ibrahim Nofal, Director General of the General Administration of Fish Farms, Eng. Eman Ezz El-Din from the General Administration of Fish Farms, and Mr. Alaa El-Din Fikry from the Security Department.
Fishing operations also continued at the Zawya Fish Farm in Kafr El-Sheikh Governorate, producing 42 tons from two fish ponds covering an area of 12 feddans. Present were Dr. Ahmed Sani El-Din, Head of the Central Administration for Production and Operations, Eng. Mohamed Zidan, Head of the Central Administration for the Central Delta Fishery Region in Kafr El-Sheikh, Eng. Hassan Badr, Director of Zawya Fish Farm, Eng. Ola Ibrahim from the General Administration of Fish Farms, Eng. Sameh El-Bandary, as well as Mr. Essam Gomaa and Mr. Ahmed Abbas from the Security Department.
Major General (Ret.) El-Hussein Farhat, Executive Director of the Authority, stated that the Authority adopts an integrated strategy aimed primarily at raising the efficiency of fish farms and hatcheries and developing them to achieve the highest possible fish production rates. This comes within the framework of Egypt’s support for the fishery sector and the great attention given by His Excellency President Abdel Fattah El-Sisi to aquaculture, recognizing it as a key development pillar that enhances the sustainability of fish resources. He praised the efforts of the farm workers and hatchery staff and expressed his sincere thanks and appreciation to them.
The Executive Director also affirmed the Authority’s keenness to increase productivity this year by providing the best conditions for fish growth, noting that the fishing season offers important job opportunities for local residents, many of whom work in fishing and marketing operations, in addition to contributing to supporting the national economy.
Mr. El-Quseir, Minister of Agriculture and Land Reclamation, held a meeting with some senior officials of the Ministry and the Fishery Authority.
Mr. El-Quseir, Minister of Agriculture and Land Reclamation, held a meeting with some senior officials of the Ministry and the Fishery Authority, in the presence of Eng. Mostafa El-Sayad, Deputy Minister of Agriculture for Livestock, Fisheries, and Poultry.
During the meeting, El-Quseir emphasized implementing the President’s directives to develop and improve Egyptian lakes, prevent any encroachments on them, and immediately remove any attempts at trespassing. He also stressed making the best possible use of the Authority’s assets, particularly unused fish farms and hatcheries, to achieve their intended objectives of increasing productivity and providing job opportunities, either by leasing them or operating them through the private sector.
The Minister of Agriculture also highlighted the need to modernize fishing methods, focus on improving fish feed production, and increase the capacity of fish hatcheries to produce fry—both marine and freshwater—to supply lakes and farms.
El-Quseir also directed the encouragement of aquaculture in desert areas and the establishment of integrated agricultural projects for plant, livestock, poultry, and fish production
Within the framework of cooperation between the Cooperative Union for Aquatic Wealth and CARE, this book was prepared to document the establishment and development of cooperative organizations in the field of fisheries, the challenges they face, and the role of the Cooperative Union for Aquatic Wealth in addressing them. It also records the achievements accomplished throughout its journey, which began in 1960 and continued until 2015, the year of publication.
The book highlights the role of pioneering leaders in establishing and developing cooperative organizations and the successive cooperative leaderships’ contributions in providing services and reforms—not only to support cooperative associations operating in fisheries and fish farms but also in founding the first governmental body responsible for managing and developing fish resources, the General Authority for Fish Resources Development.
The Cooperative Union for Aquatic Wealth dedicates this book to successive generations of cooperators in the fisheries sector to serve as a beacon guiding and encouraging them to carry the banner and uphold the noble principles of cooperation.
It instills values of selflessness and dedicated service to their communities, inspired by the pioneers of the movement—people of principles and high ideals who acted for the good of others without seeking personal gain, defended their beliefs and organizational integrity with courage, upheld the truth, and rejected hypocrisy and falsehood. They sought a decent life for their families and communities in the fishing sector and strived to preserve fish resources, which are Egypt’s wealth and a legacy for future generations.
As stated in the Holy Qur’an: "Among the believers are men who have been true to their covenant with Allah; of them some have completed their vow, and some are still waiting; but they have never changed (their determination) in the least."
— Surah Al-Ahzab, Verse 23
Finally, I extend my sincere thanks and appreciation to the former and current members of the boards of directors for their efforts in supporting the Union’s journey. I also thank Mr. Mustafa Adam Abdel-Taleb, a distinguished cooperator who provided us with historical information and data on fisheries cooperatives, and Dr. Ahmed Baraniya, the scientific advisor to the Union, for his contributions in presenting the Union’s perspective to officials and scientific forums and assisting in the preparation of this book.
AQUACULTURE
Boosting Arab fish supply from off-shore cage aquaculture
Arab countries need additional fish supply With the uncertain potential to increase fish supply from marine and inland capture fisheries, the fu ture of increasing fish supply in the Arab countries most likely will lie in aquaculture and/or importa tion. Aquaculture, in inland and marine waters, is becoming a well established activity outside the traditional confines of many Arab countries with growth in some countries faster than in others. It has become popular because it provides a source of income rather than simple subsistence and can be incorporated into local agriculture systems to diversify the production base.
The current total Arab population is around 360 million people and is expected to increase to about 430 million people in the year 2020 with an estimated average growth rate of 2% a year. The current estimated total fish landings from all sources is around 3.5 million tonnes of which
2.8 million tonnes from capture fisheries and 0.7 million tonnes from aquaculture. Furthermore, almost all Arab countries import fish and fish pro ducts from outside the region to boost local fish landings. Total current Arab countries imports are around 740,000 tonnes while exporting around 656,000 tonnes mostly due to Moroccan exports. The current annual per capita fish consumption from all sources, including imports and excluding exports, is around 10 kg/year. This rate ranging in various Arab countries from about 1.0 kg/year to 28 kg/year while the international average is around 17 kg/year. However, most Arab countries have an average consumption of less than 10 kg/ year. With these figures in mind the projected extra need for fish supply by the year 2020 at the current rate of the per capita consumption is at least 20% of current supply
The Arab countries spend billions of hard curren cies annually on food imports and food prices are skyrocketing. Food security is becoming a matter of national security and the well being of a large sector of local communities. With food security as a top priority, the development of a sustainable marine aquaculture industry would help reduce importing much of what it can produce within its borders
Source for the additional fish Supply As noted above, the current sources of fish sup ply to boost Arab countries’ current fish available sources for consumption are uncertain from the current sources of capture fisheries which are cur rently facing depleted resources and from limited inland aquaculture. This uncertainty is due to several reasons some of which are overexploita tion, pollution, environmental concerns, coastal degradation, hydropower and competition with other shore line activities such as tourism. Further more, while aquaculture in fresh water bodies is expanding but again it is facing various develop mental problems such as scarcity in water availa bility, competition for land with agriculture, buil ding and construction and other related issues in addition to lack of proper legislation and gover nance of the sector. However, some inshore ma rine aquaculture is beginning to be practiced, especially shrimp farming along the Red Sea coast of Saudi Arabia but it still remains a limited f ish source in the region except possibly in Egypt.
40 maps that explain the Middle East
Maps can be a powerful tool for understanding the world, particularly theMiddle East, a place in many ways shaped by changing political borders and demographics. Here are 40 maps crucial for understanding theMiddle East— its history, its present, and some of the most important stories in the region today.
Middle EastHistory
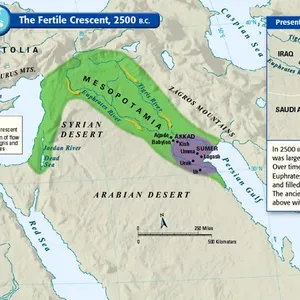
The fertile crescent, the cradle of civilization
If this area wasn't the birthplace of human civilization, it was at least a birthplace of human civilization. Called "the fertile crescent" because of its lush soil, the "crescent" of land mostly includes modern-dayIraq,Syria,Jordan, and Israel-Palestine. (Some definitions also include theNileRivervalley inEgypt.) People started farming here in 9000 BC, and by around 2500 BC the Sumerians formed the first complex society that resembles what we'd now call a "country," complete with written laws and a political system. Put differently, there are more years between Sumerians and ancient Romans than there are between ancient Romans and us.
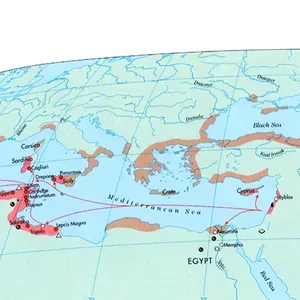
How ancient Phoenicians spread from Lebanon across the Mediterranean
The Phoenicians, who lived in present-dayLebanonand coastalSyria, were pretty awesome. From about 1500 to 300 BC, they ran some of theMediterranean's first big trading networks, shown in red, and dominated the sea along with the Greeks, who are shown in brown. Some sailed as far as the British Isles, and many of them set up colonies inNorth Africa,Spain,Sicily, andSardinia. This was one of the first of many close cultural links between the Middle East and North Africa – and whyLibya's capital,Tripoli, still bears the name of the ancient Phoenician colony that established it.
How the Middle East gaveEuropereligion, three times
The Middle East actually gaveEuropereligion four times, including Islam, but this map shows the first three. First was Judaism, which spread through natural immigration and when Romans forcibly dispersed the rebelling Israelites in the first and second century AD. In the first through third centuries A.D., a religion called Mithraism — sometimes called a "mystery religion" for its emphasis on secret rites and clandestine worship — spread from present-day Turkey or Armenia throughout the Roman Empire (at the time, most adherents believed it was from Persians in modern-day Iran, but this is probably wrong). Mithraism was completely replaced with Christianity, which became theRoman Empire's official religion, after a few centuries. It's easy to forget that, for centuries, Christianity was predominantly a religion of Middle Easterners, who in turn converted Europeans.
Overall, fishing levels have remained stable in recent years but are significantly lower than the record years of the 1980s — 1.2 million tons in 2016 compared with 2 million tons in 1982.
The 1.2 million tons caught in 2016 consisted of 830,000 tons from the Mediterranean and 390,000 tons from the Black Sea. Most of the catch comes from small pelagic fish (sardines and anchovies account for about one-third of the total catch), although the catch includes a wide variety of species compared with other regions of the world.
Across the region, Turkey remained the leading fishing country during 2014–2016 with 321,800 tons (26 percent of total catches), followed by Italy with 185,300 tons (16 percent). Algeria and Greece maintained their shares with 96,300 tons (8 percent) and 65,700 tons (5 percent) respectively. Tunisia and Croatia showed increases, while Spain’s share declined slightly.
By sub-region, the Black Sea remains the largest contributor to capture fisheries production with 32 percent of the total, followed by the Western Mediterranean (22 percent), the Adriatic Sea (16 percent), and both the Eastern and Central Mediterranean (15 percent each).
Discards and Bycatch Remain a Concern
About 275,000 tons of fish are discarded every year.
Around 230,000 tons are discarded annually in the Mediterranean, representing about 18 percent of the total catch, while discards in the Black Sea are estimated at 45,000 tons (about 10–15 percent of total catches).
Some fishing sectors generate more discards than others. For example, trawl fisheries account for more than 40 percent of discards in some areas, while small-scale fisheries usually discard less than 10 percent.
According to the report, bycatch of endangered species is relatively rare but still significant due to conservation concerns. Sea turtles are the most frequently affected species (appearing in 8 out of 10 bycatch reports), followed by sharks, rays, and chimaeras. Seabirds and marine mammals are less commonly recorded in bycatch reports.
The report was released during the First GFCM Forum on Fisheries Science (Fish Forum 2018) held at FAO headquarters from 10–14 December, highlighting the importance of improving knowledge for sustainable fisheries management.
Other Facts and Figures
Marine fisheries in the Mediterranean and Black Sea generate about 2.8 billion USD annually and employ nearly 250,000 people.
Unlike other major fishing regions, fisheries in these seas exploit a wide diversity of species rather than large single-species stocks.
The officially reported fishing fleet in 2017 consisted of about 86,500 vessels, 6,000 fewer than in 2014.
Small vessels represent the majority of the fleet (83% in the Mediterranean and 91% in the Black Sea).
Small-scale fishing provides 59% of jobs but only 26% of total revenues.
Workers on small vessels earn about half the income of those on larger industrial fishing vessels.
The Mediterranean and Black Sea are among the most closely monitored fishing regions in the world, with scientific assessments covering commercial species that represent about 50% of total catches
Any provision that contradicts the provisions of this law is hereby repealed.
Article (7)
This law shall be published in the Official Gazette and shall come into force on the day following its publication.
This law shall be stamped with the State Seal and implemented as one of its laws.
Issued at the Presidency of the Republic on 9 Dhu al-Qi'dah 1403 (18 August 1983).
Aquatic Resources Cooperatives Law
Chapter One
General Provisions
Article (1)
Aquatic resources cooperatives are socio-economic units that aim to develop and enhance aquatic resources in their various fields, provide various services to their members, and contribute to social development in their areas of operation.
This is done with the goal of raising the economic and social standards of their members and others within the framework of the State's general plan and in accordance with internationally recognized principles.
Article (2)
Legal entities, with the exception of local units and wholly state-owned public sector units, may not contribute to cooperative societies established under this law.
Societies formed under the provisions of this law may contribute to higher-level cooperative societies as stipulated herein.
The executive regulations shall specify the maximum contribution each may make to the society's capital.
Article (3)
The founders are those who participate in establishing a cooperative society, sign its founding contract, and prepare its bylaws.
They are jointly liable for all obligations arising from the establishment of the society and for all subscribed funds until they are handed over to the first board of directors.
They are also entitled to reimburse any expenses decided upon by the general assembly.
Article (4)
The society acquires legal personality upon registration of its founding contract with the General Authority for Fish Resources Development and publication of a summary of its bylaws in the Official Gazette.
The executive regulations specify the method for establishing the association, the procedures for its registration, and the common data in its bylaws.
Article (5)
Appeals against decisions issued by the competent minister and the General Authority for Fish Resources Development, in accordance with the provisions of this law, shall be filed before the Administrative Court.
Chapter Two
The Cooperative Structure for Aquatic Resources
Article (6)
The cooperative structure consists of aquatic resource cooperatives and the cooperative union for aquatic resources.
Aquatic resource cooperatives may be local, joint, or general.
Article (7)
A local cooperative shall consist of at least twenty members and shall operate within one or more fishing areas of suitable economic size.
The General Authority for Fish Resources Development shall issue a decision specifying the area.
The association's bylaws shall specify its headquarters and area of operation.
The General Authority for Fish Resources Development may, by decision, establish more than one aquatic resource cooperative of the same type within a single fishing area.
Article (8)
Any two or more local cooperative societies may establish a joint cooperative society specializing in providing economic, financial, or social services required by its member societies, or determining the means to ensure that these societies provide such services and supply the materials consumed by these societies.
Individuals may not be admitted as members.
Local cooperative societies and joint cooperative societies may form general cooperative societies among themselves.
Article (9)
The Cooperative Union for Aquatic Resources consists of local, joint, and general cooperative societies.
The Union's mission is to promote cooperation, defend the interests of cooperative societies, guide them in promoting cooperation and defending their interests, advise them in managing their affairs, audit their accounts, inspect their operations, instill a cooperative spirit, and assist citizens in establishing cooperative societies.
To this end, it may appoint supervisors, organizers, and auditors for these activities.
Chapter Three
Tasks of Cooperative Water Resources Units
Article (10)
Local associations shall carry out their activities in the areas of production, development, and marketing of water resources, and shall provide the services required by the needs of their members within their respective areas
Chapter Four
Funds of the Cooperative Society
Section One
Sources of the Society’s Funds
Article (15)
The funds of the society shall consist of the following:
First: Contributed Capital The capital shall consist of an unlimited number of shares. The internal bylaws of the society shall determine the value of each share, provided that it shall not be less than one Egyptian pound in local societies. Subscription in such societies shall be as follows:
(a) Owners of motorized fishing vessels: Subscription shall be at a minimum of one share for each horsepower of the vessels in their possession, whether owned or leased.
(b) Owners of sailing vessels: Subscription shall be at a minimum of one share for each crew member of the vessel in their possession, whether owned or leased.
(c) Shore fishermen and those in a similar status: Subscription shall be at a minimum of one share.
(d) Fish farming cooperatives and similar entities: The value of the share shall not be less than one hundred Egyptian pounds.
For joint and general cooperatives, the minimum value of a share shall be five Egyptian pounds, and the subscription of each cooperative shall not be less than one hundred shares.
In all cases, the full value of the shares shall be paid upon subscription. The boards of directors of existing societies, after re-registration in accordance with this law, shall determine the method and period of subscription in accordance with its provisions, provided that such period shall not exceed three years.
Second: In-kind contributions, the valuation and method of payment of which shall be determined by the executive regulations.
Third: The legal reserve and any other provisions or reserves established by the society.
Fourth: Any surplus achieved during the fiscal year.
Fifth: Donations and bequests received from non-foreign entities, accepted by the society, provided they do not include conditions that conflict with its objectives. The executive regulations shall specify the procedures for their acceptance and the manner of implementing any conditions imposed by the donor or testator that do not conflict with the objectives of the society. Donations and bequests not allocated for a specific purpose shall accrue to the legal reserve.
Sixth: Amounts allocated by the State, local administrative units, and public legal entities to support the societies. The executive regulations shall specify the rules and systems governing the allocation and use of such support.
Seventh: Loans required for carrying out the society’s activities. The executive regulations shall determine the rules governing lending and borrowing in accordance with the nature of the society’s activities.
Article (16)
Shares shall be nominal and indivisible, and may not be subject to attachment except in settlement of debts due to the society. The executive regulations shall specify the procedures for payment, redemption, and disposal of shares.
Section Two
Distribution of Surplus
Article (17)
For the purposes of applying the provisions of this law, “surplus” shall mean the remaining surplus realized from current operations during the fiscal year, after allocating the project reserve referred to in Article (19) of this law, paying all expenses, and fulfilling all obligations required for the proper functioning of the society.
The surplus shall be distributed as follows:
First: Not less than 20% shall be allocated to the legal reserve.
Second: 5% for charitable and social services.
Third: Not more than 5% shall be allocated as incentives to some or all employees of the society. Disbursement shall be made by a decision of the general assembly after approval of the society’s accounts.
Fourth: 5% for public services and for promoting cooperative and cultural awareness among the members of the society, to be spent within its area of operation.
Fifth: 5% shall be deposited in a special account through the Cooperative Union, allocated for cooperative training. The rules governing expenditure from this amount shall be issued by a decision of the Minister of Agriculture based on a proposal from the General Authority for Fish Resources Development and after consulting the Cooperative Union.
Sixth: 5% shall be deposited in a special account through the Cooperative Union for investment and allocation to support financially weak cooperatives and to settle debts owed by cooperatives undergoing liquidation. The rules governing expenditure shall be issued by a decision of the Minister of Agriculture based on a proposal from the General Authority for Fish Resources Development and after consulting the Cooperative Union.
Seventh: Not more than 10% as production incentives for some or all members of the board of directors for special efforts that have a tangible impact on the society’s capital and projects. The internal bylaws of the society shall specify the rules for distributing this percentage and the maximum amount payable to each member. Payment shall be made after approval of the accounts by the general assembly.
Eighth: Distribution of dividends on shares at a rate not exceeding 6% of the nominal value of the share, provided that the total distributed dividends do not exceed 20% of the surplus.
Ninth: The remaining surplus shall be distributed among the members as a return in proportion to their dealings with the society. Such return shall be distributed to beneficiaries within a maximum period of one month from the date of approval of the balance sheet by the general assembly. Any return not collected by its beneficiary and not offset against their transactions shall be added to the legal reserve after the lapse of three years from the date the member is notified of the amount due to them.
Article (18)
Returns resulting from the society’s transactions with non-members shall be added to the legal reserve.
Article (19)
Profits resulting from productive projects owned or managed by the society shall be allocated to a “Project Reserve,” for which a special account shall be established to support these projects. This shall take place after deducting 10% for the society’s legal reserve and allocating 25% for the cash and in-kind shares invested in the projects, all after payment of all expenses, settlement of all obligations, and payment of production incentives to project workers in a manner that links workers’ interests to the success of the work.
Article (20)
No return from the net surplus of subsequent years may be distributed if the society has incurred losses resulting in a deficit in the legal reserve or capital, except after such deficit has been covered.
Section Three
General Provisions
Article (21)
The financial year of the society shall commence on the first of July and end on the thirtieth of June of the following year, with the exception of the first financial year, which shall commence from the date of registration of the society and end on the thirtieth of June of the following year.
Article (22)
Amounts due to the Fund shall have a lien over all movable and immovable property of the debtor, ranking at the same level of priority prescribed under the Civil Code for amounts spent on seeds, fertilizers, and agricultural machinery. Amounts due to the Cooperative Support Fund for Fishermen from cooperative societies and their members may be collected through administrative seizure. The executive regulations shall specify the methods and procedures for collection in accordance with the Administrative Seizure Law.
Article (23)
Amounts due to cooperative societies from their members as a result of their dealings with the society, within the purposes stipulated in this law or its bylaws, shall be secured by a general lien on their assets, ranking at the same level of priority prescribed under the Civil Code for amounts spent on seeds, fertilizers, and agricultural machinery. The society shall have the right to collect such amounts through administrative seizure upon its request or upon the request of the General Authority for Fish Resources Development.
Article (24)
The Cooperative Support Fund for Fishermen shall grant loans to societies and their members against guarantees and in accordance with the conditions, terms, and procedures determined by a decision of its board of directors.
Article (25)
A Cooperative Insurance Fund shall be established by a decision of the President of the Republic to insure the vessels of societies and their members, as well as other types of insurance consistent with the society’s activities. The executive regulations or the internal bylaws of the Fund shall specify the method of financing the Fund, its objectives, and the conditions for payment and settlement of insurance amounts.
Article (26)
Each society shall maintain a separate account for the transactions of each of its members and non-members. Each member shall be issued a special transaction card, and the entries therein shall constitute binding evidence against both the society and the member to the extent supported by documents. The executive regulations shall specify the procedures necessary to organize such accounts and transaction cards.
Article (27)
Each society shall insure its treasury, warehouses, facilities, and assets, as well as custodians among its employees, against occupational risks, including shortages, damage, theft, fire, and breach of trust, in accordance with the system established by the General Authority for Fish Resources Development.
Article (28)
For the purposes of applying the Penal Code, the funds of the society shall be deemed public funds, and its employees and members of the board of directors shall be deemed public officials. The society’s documents, records, and seals shall be deemed official documents, records, and seals, and may not be removed from the society’s premises except in accordance with the law.
Chapter Five
Membership and Members’ Liability
Article (29)
Membership in a local cooperative society shall require the following:
The applicant must be a natural person or one of the legal entities referred to in Article (2) of this law.
The applicant must own a sailing or motorized fishing vessel, or a share thereof, or be a licensed professional fisherman. This condition shall not apply to members of fish farming cooperatives and similar entities.
The applicant must have interests related to the society’s activities within its area of operation.
The applicant must accept the society’s internal bylaws in writing and pay the value of the subscribed shares.
Article (30)
Membership shall be approved by a decision of the board of directors after verifying that the prescribed conditions have been met.
Article (31)
The liability of members for the society’s obligations shall be limited to the value of the shares owned by each member, unless the society’s internal bylaws provide for increased liability. Members of the board of directors shall be jointly liable for damages suffered by the society as a result of gross negligence committed by them during their term of membership, following an investigation resulting in a finding of liability.
Article (32)
Membership shall terminate in the following cases:
(a) Withdrawal of the member from the society, or approval by the board of directors of the transfer of all their shares to another member who meets the membership requirements. A withdrawing member shall be entitled to recover the value of their contributions after settlement of their obligations, in accordance with the latest approved balance sheet, provided that such withdrawal does not result in a reduction of the society’s capital in any single year by more than 10% of the contributed capital according to the latest approved final accounts.
(b) Expulsion by a decision of the general assembly and approval of the General Authority for Fish Resources Development. (c) Loss of any of the membership conditions stipulated in Article (29) of this law. (d) Death.
A member whose membership has ceased for any of the reasons stated in items (a), (b), or (c) shall bear a proportionate share of any deficit in the society’s capital or losses, within the limits of the value of their subscription, unless the internal bylaws provide for increased liability. In all cases, a former member or their heirs shall remain liable, within the limits of the assets devolved to them, to third parties for obligations incurred during the period of membership, for a period of two years from the date of termination of membership. If the society is dissolved during this period, such liability shall continue until the publication of the liquidation accounts.
Source: General Authority for Fish Resources Development
1. Aquatic Wealth Cooperatives within the Egyptian Cooperative Movement: Cooperation is a popular movement arising from economic and social circumstances and the individual’s awareness of the need for collective action. It is a natural behavior to unite efforts to achieve common goals. All divine religions have encouraged cooperation; thus, the cooperative sector represents true popular participation and democratic practice through democratic management, shared responsibility, and self-regulation.
Cooperation reflects the authentic Egyptian values (solidarity, tolerance, dignity of work, moderation, individual for the group and group for the individual), achieving societal balance and confronting extremism, terrorism, and unemployment. Historically, Egyptian cooperative organizations were a key aspect of national work relied upon by the Egyptian national movement in 1908, led by Mustafa Kamel and Mohamed Farid, with cooperative pioneer Omar Lotfy contributing to achieving political and economic independence, which marked the flourishing of cooperative thought.
Pioneer cooperators strived to consolidate cooperative concepts and work on issuing legislation and laws regulating cooperative work, contributing to the establishment of the General Union of Cooperatives, which includes five specialized unions: the Cooperative Union for Aquatic Wealth, Agricultural Cooperative Union, Consumer Cooperative Union, Production Cooperative Union, and Housing Cooperative Union.
2.Cooperative organizations in the fisheries sector: The first fishermen’s cooperative in Alexandria—Mariout area—was established on 5/3/1943 (The Cooperative Association of Fishermen in Mariout). The establishment of fisheries cooperatives continued until their number reached 20 by 3/8/1959 (before the Union’s foundation). The number of aquatic wealth cooperatives later grew to 98, including 11 cooperatives for fish farmers.
3. Cooperative Union for Aquatic Wealth: Establishment of the Union:
On 19/12/1959, representatives of established cooperatives met to form a union and selected a three-member committee led by Mr. Fouad Ahmed Hedia, President of the Cooperative Association of Mechanized Fishing Vessel Owners in Port Said, to take all legal and administrative procedures for registering and publicizing the Union.
The Union was registered with the Ministry of Social Affairs under No. 21 of 1960 and published in the Egyptian Gazette, issue No. 66, dated 25 August 1960, under the name "Specialized Cooperative Union for Aquatic Wealth."
The Union and its associations were subject to Law No. 317 of 1956, regulating all types of cooperatives in all forms.
The first General Assembly of the Union convened on Thursday, 10/11/1960, at the temporary headquarters in Zahraa Building No. 7, Garden City, chaired by Mr. Fouad Ahmed Hedia, acting president of the Union and representative of the Cooperative Association of Mechanized Fishing Vessel Owners in Port Said, with Mr. Saleh Mohamed Ahmed as acting secretary, representing the Cooperative Association of Fishermen in Qabooti.
The first Board of Directors was elected by acclamation:
Mr. Fouad Ahmed Hedia – Port Said Mechanized Fishing Vessel Owners Association
Mr. Ahmed Mohamed Awad – Suez Mechanized Fishing Vessel Owners Association
Mr. Abdel Hamid Mahgoub – Hurghada Fishermen Association
Mr. Saleh Mohamed Ahmed – Qabooti Fishermen Association
Mr. El-Sayed Ali Youssef – Borg El-Berles Fishermen Association
Mr. Ahmed Abdel-Tawab – Aswan Fishermen Association
Mr. Al-Husseini Mohamed Kamouna – Edko Fishermen Association
During this meeting, new members nominated by the Supreme Committee for Aquatic Wealth were accepted into the Union’s Board of Directors according to the internal regulations.
The first Board meeting took place on Monday, 19/6/1961, chaired by Field Marshal Abdel Hakim Amer, Minister of War, who explained the Ministry’s fisheries cooperation policy, which had guided all matters concerning aquatic wealth.
Reformation of the Board of Directors:
Major General Mohamed Fouad El-Degwy – President (Director General of the Coast and Fisheries Authority and Customs Guard)
Mr. Fouad Ahmed Hedia – Vice President (President of Mechanized Vessel Association in Port Said)
Mr. Gouda Shaqran – Secretary General (Fisheries Cooperation Expert, Presidency)
Mr. Ahmed Mohamed Awad – Treasurer (President of Mechanized Vessel Association in Suez)
At the end of the meeting, Field Marshal Abdel Hakim Amer presented Presidential Decree No. 444 of 1961 establishing the Support Fund for Fishermen’s Cooperatives, applying Article 24 of Law No. 317 of 1956 on cooperatives, recognizing the importance of the cooperative sector and supporting its workers. The Union was supervised by the General Directorate for Fisheries Cooperation under the Ministry of War
Organizational Structure of the Union
1. Union Members: The Cooperative Union for Aquatic Wealth comprises 98 cooperatives, including 87 local cooperatives, 1 general cooperative, and 11 fish farming cooperatives. The total number of cooperative members is approximately 100,000.
With the recent expansion of fish farming projects, the number of fish farming cooperatives continues to grow. The Union encourages their establishment and currently they have three representatives on the Board of Directors.
Types of Fisheries Cooperatives under the Law:
a) Local Cooperatives: Each local cooperative consists of at least twenty members and operates within one or more fishing areas of sufficient economic size, designated by the General Authority for Fish Resources Development (the governmental body responsible for fisheries). The cooperative’s bylaws specify its headquarters and operational area. The Authority may authorize multiple cooperatives of the same type in one fishing area.
Local cooperatives’ tasks include production, development, and marketing of aquatic resources and providing services to their members, particularly:
Supplying members with local and imported fishing tools and equipment.
Facilitating members’ ownership or access to transport for fish distribution.
Marketing aquatic products and establishing necessary marketing facilities.
Establishing and managing cooperative fish farms.
Providing loans and borrowing from various funding sources to achieve their objectives.
Offering social and cultural services to improve members’ standards of living.
Implementing training programs organized by the General Authority for Fish Resources Development in coordination with the Union.
b) Joint Cooperatives: Two or more local cooperatives can form a joint cooperative to provide economic, financial, or social services needed by the member cooperatives. Individuals cannot join as members. Tasks include maintenance of fishing vessels, marketing, processing, fish farming, and suggesting fishing schedules, methods, and professions for members.
c) General Cooperatives: A general cooperative comprises local and joint cooperatives. Its purpose is to support member cooperatives in achieving their goals and providing economic, financial, or social services, particularly:
Supplying members with machinery, equipment, spare parts, and production materials.
Conducting cooperative marketing operations.
Exporting products on behalf of members.
Establishing funds to support economic and social activities and assisting member cooperatives in creating such funds.
2. Board of Directors: The Union is managed by a Board of Directors of 19 members, elected by secret ballot during the General Assembly, with representation from each fishing area. The board term is five years.
3. Executive Committee: The Board elects from among its members an Executive Committee comprising a President, Vice President, Secretary, and Treasurer.
Union Responsibilities:
a) Tasks Assigned by the Armed Forces:
During the 1967 war, the Union evacuated more than 15,000 officers and soldiers from Sinai using fishing vessels from Port Said, some of which were sunk or damaged by enemy air strikes, and fishermen refused compensation.
During the War of Attrition, fishing vessels played a heroic role in the Mediterranean, Red Sea, and Gulf of Suez, coordinating with the Navy.
During the 1973 war, fishing units carried out tasks assigned by the Armed Forces.
In peacetime, fishing units perform tasks assigned by the Armed Forces.
b) Activities Defined by Law:
Participating in planning the cooperative movement for aquatic wealth in Egypt.
Promoting the cooperative movement in fisheries, including publishing newspapers and journals, and holding cooperative seminars.
Coordinating among cooperatives to achieve their goals.
Supervising cooperative training for fisheries cooperatives.
Coordinating between the fisheries cooperative sector and other cooperative sectors.
Holding a general fisheries cooperative conference at least once every four years and following up on decisions and recommendations.
Representing the fisheries cooperative movement abroad through membership in regional, Arab, and international cooperative organizations, attending conferences, exchanging cooperative experiences, and accepting external material assistance, in coordination with the Minister of Agriculture.
Proposing fisheries cooperative legislation.
Defending the interests of fisheries cooperatives.
4. Contribution of the Union in Establishing the General Authority for Fish Resources Development:
Since its registration in 1960, the Union was supervised by the General Directorate for Fisheries Cooperation under the Ministry of War.
Presidential Decree No. 1323 of 1961 established the Public Institution for Aquatic Wealth, tasked with supporting fisheries cooperatives financially, technically, and through training.
Law No. 111 of 1975, issued on 4/9/1975, abolished the public institutions.
Prominent board members such as Mr. Mohamed Al-Feki, Mr. Ali Zariq, Mr. El-Sayed El-Gendy, and Mr. Nour El-Din Abdullah Munir worked to establish a governmental body to replace the abolished institution. They submitted memoranda to:
President Mohamed Anwar Sadat
Dr. Rifaat El-Mahgoub, Secretary-General of the Socialist Union
Mr. Mamdouh Salem, Prime Minister
Mr. Gamal El-Atifi, Member of Parliament
Their efforts led to:
Presidential Decree No. 641 of 1976, assigning the Ministry of Agriculture to oversee the former institution’s responsibilities and establish an agency for this purpose.
Ministerial Decree No. 305 of 1977 (10/1/1977) establishing the Ministry’s Agency for Aquatic Wealth Affairs.
Issuance of Fisheries Cooperative Law No. 122 of 1980 (Agricultural Cooperatives).
The Union refused to join this law. On 25/2/1980, Mr. Mohamed Ali Al-Feki (President) and Mr. Ali Zariq (Vice President) met with Deputy Prime Minister Fikri Makram Ubaid, explaining the Union’s reasons for continuing to apply Law No. 317 of 1956 for fisheries cooperatives until a dedicated law could be issued.
The Union requested the establishment of an independent authority to manage the sector. Meetings with officials and President Sadat in 1979 and 1980 in Alexandria led to several key requests:
Establishment of a General Authority for Fish Resources Development to oversee the fisheries sector.
A dedicated law for fisheries cooperatives.
A fisheries law.
Presidential approval and directives to implement the Union’s requests.
On 8/3/1983, Mr. Mohamed Al-Feki and Mr. Ali Zariq submitted memoranda to the Minister of Agriculture to implement the President’s directives
Generally, aquaculture development has been restricted to water bodies on land, or to sea sites close to the coast, but with 70% of the earth’s surface being covered by water, the potential for marine aquaculture to expand in off-shore marine waters in order to help meeting future increasing demand for fish is considerable. On land and in coastal areas, land and water for expanding aquaculture are in limited supply and aquaculture must compete directly or indirectly with other activities in urban and coastal development. In order to overcome the constraints in aquaculture expansion off-shore, or the high seas, aquaculture is now developing as a new and reliable source of fish in large quantities to meet the demands for fish. Such an approach is already in practice and is expanding in various countries around the world such as China, the United States and other countries. The Arab countries which borders several seas and gulfs as well as having access to the waters of two oceans within their Exclusice Economic Zone (EEZ) have the opportunity to venture into off-shore marine aquaculture to boost their current supply of fish for human consumption and help reduce their net imports of fish and fish products as well as expand their export potential and raise the standards of living of their fisheries communities
Models of off-shore cage aquaculture
Aquaculture is the world’s fastest growing food sector and it possesses considerable potential for further expansion under favourable conditions on land, inshore and off-shore environments. Following the downward trend of capture production caused by over f ishing and the ecological degradation of the coastal environment, emphasis shifted from marine capture fisheries to aquaculture based operations, including farming and ranching of marine organisms both in inshore and off-shore areas. Off-shore aquaculture, or as it is also called sea farming and/or sea ranching activities, is only a small part of the whole aspects of the fishery sector. Worldwide, half the fish consumed by humans are now produced by harvesting fish in in-shore or off-shore marine waters.
In-shore cage culture is very popular world wide, especially in Asia. Advantages include low investment and easy routine management. But this system is one of the main sources of in shore pollution and the main cause for red tides. It has been reported that, in areas where in-shore cage culture is well developed, phosphorus content of the sea bottom is 2,000 times higher than the legal value accepted for environmental protection. Policy makers have begun to notice the problems and to issue regulations controlling the development of this cultural system, to protect the natural environment and the aquaculture industry itself
Marine aquaculture has several advantages over traditional capture fisheries. Since cultured fish are kept in a relatively controlled environment, it is possible to monitor production and predict the output and harvest. This makes it possible to adapt the harvest according to market demand and ensure the right size, quality, and volume of the fish at the most opportune time. These factors result in lower production costs and higher profits. In sum, when properly designed, open-ocean marine aquaculture has the potential to make aquaculture a sustainable source of protein for our globally growing population
Coastal fish farms have multiplied around the world over the last three decades and they have spawned a host of problems: fish sewage that pollutes waters and grows algae blooms, shrimp ponds created by clear-cutting manpower forests, and densely packed fish farms that too easily spread disease and parasites in the contained populations
As for off-shore cage aquaculture it operates in clean waters, characterized to rear fish in much larger quantities, and the raising of high quality and value of fish species that are in high demand. There are several models of cages that are in use around the world. Two models of such cages were innovated and are considered
suitable for deploying in off-shore Arab waters. Either of these models could form a nucleus for a good investment opportunity to boost Arab f ish supply with high quality fish aiming at raising local consumption, reducing imports, creating employment opportunities, increasing export potential, establishing processing/value added seafood production plants, etc. The models are:
Model 1: An American company developed an open ocean marine aquaculture cage which is a pyramid like cage that can be submerged in off shore waters. It is designed to avoid damage from hurricanes, typhoons and cyclones that threaten tropical seas. The cage has a rigid structural frame that is an assembly of high-density polyethylene pipe (HDPE) providing the floatation buoyancy. When filled with air, the cage floats on the water surface simplifying the transfer of the cage to the off-shore operational site where the frame members are flooded with water to submerge the cage. The model is 30 ft high and 33 ft wide. It has a 340 cubic meters in volume, weights 3,240 kg. and use 3,600 sq. ft of netting.
Model 2: A German company innovated a mobile and submersible fish cage for off-shore aquaculture with a cylindrical length of 100m. a diameter of 16 m and a volume of 20,000 m3. It is designed to have extreme stability and safe function in open seas. It has a solar powered aeration set brings air into the cage and permits a stable stocking density of up to 25kg/m3 of fish. It is said that in warm waters in the open seas it could grow fish species such as Cobia 2-3 times quicker than some other species. In such cages it is believed that over 500 tonnes of Cobia may be produced a year. The mobile and revolving cage assures easy harvesting. Such cages may be anchored in the 200 miles EEZ areas in a depth of 40 to 70 m. The cage may swim with the waters stream pivot like a rope of up to 1,000m length. Furthermore a service boat could provide logistical support of up to 5 cages 3 times a day with feed and other necessities
Future perspectives for offshore cage aquaculture in the Arab Region
As pointed out the Arab countries border several seas, gulfs and two major oceans. Several suitable sites to deploy such cages may be selected. However, it is believed that the most currently appropriate open sea to launch a marine aquaculture venture is the Arabian Sea with bases in Oman and/or Yemen. The Arabian Sea is home to more than 1,200 species of fish. It has the most intense coastal upwelling system in the world generating rich nutrients for feeding shellfish. The consequent high phytoplankton productivity and biomass along the coasts of Yemen and Oman make this region one of the richest fisheries grounds in the world.
The Arabian Sea which extends into the Indian Ocean has great potential for open-ocean marine aquaculture development. With 3,700 kilometres of coastline between Oman and Yemen both countries has untapped potential to exploit this valuable resource with the development of a marine aquaculture industry. The 200-mile exclusive economic zone, extending seaward into the Gulf of Oman and Arabian Sea, presents a promising proposition for diversifying and augmenting Oman’s and Yemen’s economies.
Arab joint ventures projects to invest in off-shore marine aquaculture would reflect positively on total Arab fish production. Since Oman and Yemen are almost self sufficient in their local fish landings, extra supplies from such ventures would be directed for export to other Arab countries that import large fish quantities such as Egypt, Saudi Arabia and other Arab markets and possibly to other regional and international markets. Increased fish production would also open various opportunities to establish fish processing plants to produce value-added seafood products for local and international markets. A marine aquaculture industry for the Arabian Sea would increase food security and mitigate
the depletion of sparse water for agricultural resources, raises the standards of living of f ishermen in coastal communities by creating jobs, generating extra income, and help diversify the economies of countries with limited natural resources. So far several high value fish and crustacean species are considered suitable for off-shore aquaculture in the Arabian Sea. These include sea bass, bigeye tuna, cobia, grouper, snapper as well as shrimps and abalone. More species could be identified in due course However, before embarking on such ventures, several studies have to be made to ensure the proper selection of off-shore cages either from the two models suggested above or possibly other models on the market as to their suitability for the marine sites selected. Studies should also include biological aspects of the resources, environmental standards, socio-economic effects, sustainability as well as the potential benefits envisaged from such ventures
When Mohammed's Caliphate conquered the Middle East
In the early 7th century AD in present-daySaudi Arabia, the Prophet Mohammed founded Islam, which his followers considered a community as well as a religion. As they spread across theArabian peninsula, they became an empire, which expanded just as the neighboring Persian and Byzantine Empires were ready to collapse. In an astonishingly short time — from Mohammed's death in 632 to 652 AD — they managed to conquer the entire Middle East,North Africa,Persia, and parts of southernEurope. They spread Islam, the Arabic language, and the idea of a shared Middle Eastern identity — all of which still define the region today. It would be as if everyone inEuropestill spoke Roman Latin and considered themselves ethnically Roman.
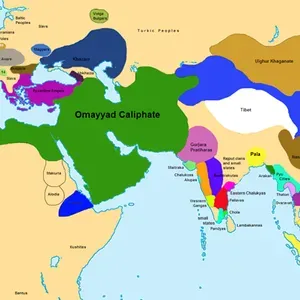
A map of the world at the Caliphate's height
This is a rough political map of the world in 750 AD, at the height of the Omayyad Caliphate ("caliph" means the ruler of the global Islamic community). This is to give you a sense of how vast and powerful the Muslim empire had become, barely one century after the founding of the religion that propelled its expansion. It was a center of wealth, arts, and learning at a time when onlyChinawas so rich and powerful. This was the height of Arab power.
The six-century rise and fall of theOttoman Empire
The Ottoman Empire is named for Osman, its first ruler, who in the early 1300s expanded it from a tiny part of northwestTurkeyto a slightly less tiny part. It continued expanding for about 500 years — longer than the entire history of the Roman Empire — ruling over most of the Middle East, North Africa, and southeasternEuropefor centuries. The empire, officially an Islamic state, spread the religion in southeastEuropebut was generally tolerant of other religious groups. It was probably the last great non-European empire until it began declining in the mid-1800s, collapsed after World War I, and had its former territory in the Middle East divided up byWestern Europe.
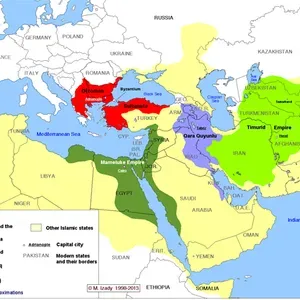
What theMiddle Eastlooked like in 1914
This is a pivotal year, during theMiddle East's gradual transfer from 500 years of Ottoman rule to 50 to 100 years of European rule. Western Europe was getting richer and more powerful as it carved up Africa, including the Arab states ofNorth Africa, into colonial possessions. Virtually the entire region was ruled outright by Europeans or Ottomans, save some parts ofIranand theArabian peninsuladivided into European "zones of influence." When World War I ended a few years later, the rest of the defeatedOttoman Empirewould be carved up among the Europeans. The lines between French, Italian, Spanish, and British rule are crucial for understanding the region today – not just because they ruled differently and imposed different policies, but because the boundaries between European empires later became the official borders of independence, whether they made sense or not.
The Sykes-Picot treaty that carved up the Middle East
You hear a lot today about this treaty, in which theUKand French (and Russian) Empires secretly agreed to divide up theOttoman Empire's last MidEastern regions among themselves. Crucially, the borders between the French and British "zones" later became the borders betweenIraq,Syria, andJordan. Because those later-independent states had largely arbitrary borders that forced disparate ethnic and religious groups together, and because those groups are still in terrible conflict with one another, Sykes-Picot is often cited as a cause of warfare and violence and extremism in theMiddle East. But scholars are still debating this theory, which may be too simple to be true.
An animated history of great empires in the Middle East
You may have noticed a theme of the last eight maps: empires, mostly from outside theMiddle Eastbut sometimes of it, conquering the region in ways that dramatically changed it. This animation shows you every major empire in theMiddle Eastover the last 5,000 years. To be clear, it is not exhaustive, and in case it wasn't obvious, the expanding-circle animations do not actually reflect the speed or progression of imperial expansions. But it's a nice primer.
The complete history of Islamic states
This time-lapse map by Michael Izady — a wonderful historian and cartographer at Columbia University, whose full collection can be found here — shows the political boundaries of the greater Middle East from 1450 through today. You'll notice that, for much of the last 500 years, most or all of the region has been under some combination of Turkish, Persian, and European control. For so much of the Arab Middle East to be under self-rule is relatively new. Two big exceptions that you can see on this map areMoroccoandEgypt, which have spent more of the last 500 years as self-ruling empires than other Arab states. That's part of why these two countries have sometimes seen themselves as a degree apart from the rest of the Arab world.
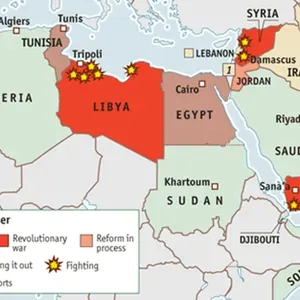
The 2011 Arab Spring
It is still amazing, looking back at early and mid-2011, how dramatically and quickly the Arab Spring uprisings challenged and in many cases toppled the brittle old dictatorships of theMiddle East. What's depressing is how little the movements have advanced beyond those first months.Syria's civil war is still going.Egypt's fling with democracy appeared to end with a military coup in mid-2013.Yemenis still mired in slow-boil violence and political instability. The war inLibyatoppled Moammar Qaddafi, with US and European support, but left the country without basic security or a functioning government. OnlyTunisiaseems to have come out even tenuously in the direction of democracy.
TheMiddle Easttoday
Wikimedia
The dialects of Arabic today
This map shows the vast extent of the Arabic-speaking world and the linguistic diversity within it. Both go back to the Caliphates of the sixth and seventh century, which spread Arabic from its birthplace on the Arabian Peninsula across Africa and theMiddle East. Over the last 1,300 years the language's many speakers have diverged into distinct, sometimes very different, dialects. Something to look at here: where the dialects do and do not line up with present-day political borders. In places where they don't line up, you're seeing national borders that are less likely to line up with actual communities, and in some cases more likely to create problems.
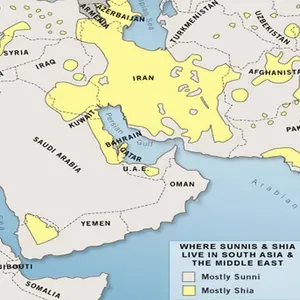
The Sunni-Shia divide
The story of Islam's division between Sunni and Shia started with the Prophet Mohammed's death in 632. There was a power struggle over who would succeed him in ruling the Islamic Caliphate, with most Muslims wanting to elect the next leader but some arguing that power should go by divine birthright to Mohammed's son-in-law, Ali. That pro-Ali faction was known as the "Partisans of Ali," or "Shi'atu Ali" in Arabic, hence "Shia." Ali's eventual ascension to the throne sparked a civil war, which he and his partisans lost. The Shia held on to the idea that Ali was the rightful successor, and grew into an entirely separate branch of Islam. Today about 10 to 15 percent of Muslims worldwide are Shia — they are the majority group inIranandIraqonly — while most Muslims are Sunni. "Sunni" roughly means "tradition." Today, that religious division is again a political one as well: it's a struggle for regional influence between Shia political powers, led byIran, versus Sunni political powers, led bySaudi Arabia. This struggle looks an awful lot like a regional cold war, with proxy battles inSyriaand elsewhere.
Michael Izady /ColumbiaUniversity
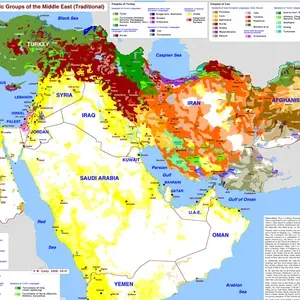
The ethnic groups of the Middle East
The most important color on this map of Middle Eastern ethnic groups is yellow: Arabs, who are the majority group in almost everyMidEastcountry, including the North African countries not shown here. The exceptions are mostly-JewishIsraelin pink, mostly-TurkishTurkeyin green, mostly-PersianIranin orange, and heavily diverseAfghanistan. (More on the rich diversity ofIranandAfghanistanbelow.) That splash of red in the middle is really important: ethnic Kurds, who have no country of their own but big communities inIran,Iraq,Syria, andTurkey. But the big lesson of this map is that there is a belt of remarkable ethnic diversity fromTurkeytoAfghanistan, but that much of the rest of the region is dominated by ethnic Arabs.
Pew Forum
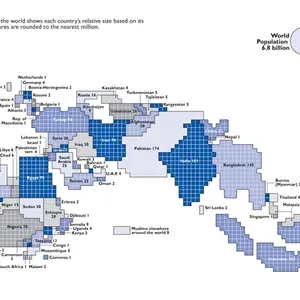
Weighted Muslim populations around the world
This map makes a point about what theMiddle Eastis not: it is not synonymous with the Islamic world. This weighted population map shows every country in the world by the size of its Muslim population. Countries with more Muslim citizens are larger; countries with fewer Muslim citizens are smaller. You'll notice right away that theMiddle Eastmakes up just a fraction of the world's total Muslim population. There are far more Muslims, in fact, in the South Asian countries ofIndia,Pakistan, andBangladesh. The biggest Muslim population by far isIndonesia's, in southeast Asia. And there are millions in sub-SaharanAfricaas well. The Islamic world may have begun in theMiddle East, but it's now much, much larger than that.
Palestine
Israel's 1947 founding and the 1948 Israeli-Arab War
These three maps show howIsraelwent from not existing to, in 1947 and 1948, establishing its national borders. It's hard to identify a single clearest start point to the Israel-Palestine conflict, but the map on the left might be it: these are the borders that the United Nations demarcated in 1947 for a Jewish state and an Arab state, in what had been British-controlled territory. The Palestinians fought the deal, and in 1948 the Arab states ofEgypt,Jordan,Iraq, andSyria invaded. The middle map shows, in green, how far they pushed back the Jewish armies. The right-hand map shows how the war ended: with an Israeli counterattack that pushed into the orange territory, and withIsraelclaiming that as its new national borders. The green is what was left for Palestinians.
A map of the world at the Caliphate's height
This is a rough political map of the world in 750 AD, at the height of the Omayyad Caliphate ("caliph" means the ruler of the global Islamic community). This is to give you a sense of how vast and powerful the Muslim empire had become, barely one century after the founding of the religion that propelled its expansion. It was a center of wealth, arts, and learning at a time when onlyChinawas so rich and powerful. This was the height of Arab power.
The six-century rise and fall of theOttoman Empire
The Ottoman Empire is named for Osman, its first ruler, who in the early 1300s expanded it from a tiny part of northwestTurkeyto a slightly less tiny part. It continued expanding for about 500 years — longer than the entire history of the Roman Empire — ruling over most of the Middle East, North Africa, and southeasternEuropefor centuries. The empire, officially an Islamic state, spread the religion in southeastEuropebut was generally tolerant of other religious groups. It was probably the last great non-European empire until it began declining in the mid-1800s, collapsed after World War I, and had its former territory in the Middle East divided up byWestern Europe.
What theMiddle Eastlooked like in 1914
This is a pivotal year, during theMiddle East's gradual transfer from 500 years of Ottoman rule to 50 to 100 years of European rule. Western Europe was getting richer and more powerful as it carved up Africa, including the Arab states ofNorth Africa, into colonial possessions. Virtually the entire region was ruled outright by Europeans or Ottomans, save some parts ofIranand theArabian peninsuladivided into European "zones of influence." When World War I ended a few years later, the rest of the defeatedOttoman Empirewould be carved up among the Europeans. The lines between French, Italian, Spanish, and British rule are crucial for understanding the region today – not just because they ruled differently and imposed different policies, but because the boundaries between European empires later became the official borders of independence, whether they made sense or not.
1.Financial Times
The Sykes-Picot treaty that carved up the Middle East
You hear a lot today about this treaty, in which theUKand French (and Russian) Empires secretly agreed to divide up theOttoman Empire's last MidEastern regions among themselves. Crucially, the borders between the French and British "zones" later became the borders betweenIraq,Syria, andJordan. Because those later-independent states had largely arbitrary borders that forced disparate ethnic and religious groups together, and because those groups are still in terrible conflict with one another, Sykes-Picot is often cited as a cause of warfare and violence and extremism in theMiddle East. But scholars are still debating this theory, which may be too simple to be true.
2. Maps of War
An animated history of great empires in the Middle East
You may have noticed a theme of the last eight maps: empires, mostly from outside theMiddle Eastbut sometimes of it, conquering the region in ways that dramatically changed it. This animation shows you every major empire in theMiddle Eastover the last 5,000 years. To be clear, it is not exhaustive, and in case it wasn't obvious, the expanding-circle animations do not actually reflect the speed or progression of imperial expansions. But it's a nice primer.
The complete history of Islamic states
This time-lapse map by Michael Izady — a wonderful historian and cartographer at Columbia University, whose full collection can be found here — shows the political boundaries of the greater Middle East from 1450 through today. You'll notice that, for much of the last 500 years, most or all of the region has been under some combination of Turkish, Persian, and European control. For so much of the Arab Middle East to be under self-rule is relatively new. Two big exceptions that you can see on this map areMoroccoandEgypt, which have spent more of the last 500 years as self-ruling empires than other Arab states. That's part of why these two countries have sometimes seen themselves as a degree apart from the rest of the Arab world.
1. The Economist
The 2011 Arab Spring
It is still amazing, looking back at early and mid-2011, how dramatically and quickly the Arab Spring uprisings challenged and in many cases toppled the brittle old dictatorships of theMiddle East. What's depressing is how little the movements have advanced beyond those first months.Syria's civil war is still going.Egypt's fling with democracy appeared to end with a military coup in mid-2013.Yemenis still mired in slow-boil violence and political instability. The war inLibyatoppled Moammar Qaddafi, with US and European support, but left the country without basic security or a functioning government. OnlyTunisiaseems to have come out even tenuously in the direction of democracy.
TheMiddle Easttoday
2. The dialects of Arabic today
This map shows the vast extent of the Arabic-speaking world and the linguistic diversity within it. Both go back to the Caliphates of the sixth and seventh century, which spread Arabic from its birthplace on the Arabian Peninsula across Africa and theMiddle East. Over the last 1,300 years the language's many speakers have diverged into distinct, sometimes very different, dialects. Something to look at here: where the dialects do and do not line up with present-day political borders. In places where they don't line up, you're seeing national borders that are less likely to line up with actual communities, and in some cases more likely to create problems.
The Sunni-Shia divide
The story of Islam's division between Sunni and Shia started with the Prophet Mohammed's death in 632. There was a power struggle over who would succeed him in ruling the Islamic Caliphate, with most Muslims wanting to elect the next leader but some arguing that power should go by divine birthright to Mohammed's son-in-law, Ali. That pro-Ali faction was known as the "Partisans of Ali," or "Shi'atu Ali" in Arabic, hence "Shia." Ali's eventual ascension to the throne sparked a civil war, which he and his partisans lost. The Shia held on to the idea that Ali was the rightful successor, and grew into an entirely separate branch of Islam. Today about 10 to 15 percent of Muslims worldwide are Shia — they are the majority group inIranandIraqonly — while most Muslims are Sunni. "Sunni" roughly means "tradition." Today, that religious division is again a political one as well: it's a struggle for regional influence between Shia political powers, led byIran, versus Sunni political powers, led bySaudi Arabia. This struggle looks an awful lot like a regional cold war, with proxy battles inSyriaand elsewhere.
The ethnic groups of the Middle East
The most important color on this map of Middle Eastern ethnic groups is yellow: Arabs, who are the majority group in almost everyMidEastcountry, including the North African countries not shown here. The exceptions are mostly-JewishIsraelin pink, mostly-TurkishTurkeyin green, mostly-PersianIranin orange, and heavily diverseAfghanistan. (More on the rich diversity ofIranandAfghanistanbelow.) That splash of red in the middle is really important: ethnic Kurds, who have no country of their own but big communities inIran,Iraq,Syria, andTurkey. But the big lesson of this map is that there is a belt of remarkable ethnic diversity fromTurkeytoAfghanistan, but that much of the rest of the region is dominated by ethnic Arabs.
Weighted Muslim populations around the world
This map makes a point about what theMiddle Eastis not: it is not synonymous with the Islamic world. This weighted population map shows every country in the world by the size of its Muslim population. Countries with more Muslim citizens are larger; countries with fewer Muslim citizens are smaller. You'll notice right away that theMiddle Eastmakes up just a fraction of the world's total Muslim population. There are far more Muslims, in fact, in the South Asian countries ofIndia,Pakistan, andBangladesh. The biggest Muslim population by far isIndonesia's, in southeast Asia. And there are millions in sub-SaharanAfricaas well. The Islamic world may have begun in theMiddle East, but it's now much, much larger than that.
Palestine
Israel's 1947 founding and the 1948 Israeli-Arab War
These three maps show howIsraelwent from not existing to, in 1947 and 1948, establishing its national borders. It's hard to identify a single clearest start point to the Israel-Palestine conflict, but the map on the left might be it: these are the borders that the United Nations demarcated in 1947 for a Jewish state and an Arab state, in what had been British-controlled territory. The Palestinians fought the deal, and in 1948 the Arab states ofEgypt,Jordan,Iraq, andSyria invaded. The middle map shows, in green, how far they pushed back the Jewish armies. The right-hand map shows how the war ended: with an Israeli counterattack that pushed into the orange territory, and withIsraelclaiming that as its new national borders. The green is what was left for Palestinians.
The 1967 Israeli-Arab War that set today's borders
These three maps (click the expand icon to see the third) show how those 1948 borders became what they are today. The map on left shows the Palestinian territories ofGaza, which was under Egyptian control, and theWest Bank, under Jordanian control. In 1967,Israel fought a war withEgypt,Jordan, andSyria. The war ended withIsraeloccupying both of the Palestinian territories, plus the Golan Heights inSyriaandEgypt'sSinai peninsula: that's shown in the right map.Israelgave Sinai back as part of a 1979 peace deal, but it still occupies those other territories.Gazais today under Israeli blockade, while theWest Bankis increasingly filling with Israeli settlers. The third map shows how the West Bank has been divided into areas of full Palestinian control (green), joint Israeli-Palestinian control (light green), and full Israeli control (dark green).
Israeli settlements in the Palestinian West Bank
Since 1967, Israelis have been moving into settlements in theWest Bank. Some go for religious reasons, some because they want to claim Palestinian land forIsrael, and some just because they get cheap housing from subsidies. There about 500,000 settlers in 130 communities, which you can see in this map. The settlements make peace harder, which is sometimes the point: for Palestinians to have a state, the settlers will either to have to be removed en masse, or Palestinians would have to give up some of their land. The settlements also make life harder for Palestinians today, dividing communities and imposing onerous Israeli security. This is why theUSand the rest of the world opposes Israeli settlements. ButIsraelis continuing to expand them anyway.
Israeli and Hezbollah strikes in the 2006 Lebanon War
This map shows a moment in the 2006 war betweenIsraelandLebanon. It also shows the way that war betweenIsraeland its enemies has changed:Israelnow has the dominant military, but the fights are asymmetrical.Israelwasn't fighting a state, but the Lebanese militant group Hezbollah. It launched many air and artillery strikes inLebanon(shown in blue) to weaken Hezbollah, destroying much of the country's infrastructure in the process.Israelalso blockaded Lebanese waters. Hezbollah fought a guerrilla campaign against the Israeli invasion force and launched many missiles into Israeli communities. The people most hurt were regular Lebanese and Israelis, hundreds of thousands of whom were displaced by the fighting.
Which countries recognizeIsrael,Palestine, or both
The Israel-Palestine conflict is a global issue, and as this map shows it's got a global divide. Many countries, shown in green, still do not recognizeIsraelas a legitimate state. Those countries are typically Muslim-majority (that includesMalaysiaandIndonesia, way over in southeast Asia). Meanwhile, the blue countries of the West (plus a few others) do not recognizePalestineas a country. They still have diplomatic relations withPalestine, but in their view it will not achieve the status of a country until the conflict is formally resolved. It is not a coincidence that there has historically been some conflict between the blue and green countries.
Syria
Syria's religious and ethnic diversity
Each color here shows a different religious group in the part of the eastern Mediterranean called theLevant. It should probably not be surprising that the birthplace of Judaism and Christianity is religiously diverse, but this map drives home just how diverse.Israelstands out for its Jewish majority, of course, but this is also a reminder of its Muslim and other minorities, as well as of the Christian communities inIsraeland theWest Bank.Lebanonis divided among large communities of Sunnis, Shias, Christians, and a faith known as Druze — they're at peace now, but the country's horrific civil war from 1975 to 1990 divided them. There may be a similar effect happening inSyria, which is majority Sunni Muslim but has large minorities of Christians, Druze, Shia, and a Shia sect known as Alawites whose members include Syrian leader Bashar al-Assad and much of his government.
Current areas of control in the Syrian Civil War
This map shows the state of play inSyria's civil war, which after three years of fighting has divided between government forces, the anti-government rebels who began as pro-democracy protestors, and the Islamist extremist fighters who have been moving in over the last two years. You may notice some overlap between this map and the previous: the areas under government control (in red) tend to overlap with where the minorities live. The minorities tend to be linked to the regime, whereas the rebels are mostly from the Sunni Muslim majority. But the anti-government Syrian rebels (in green) have been taking lots of territory.Syria's ethnic Kurdish minority also has militias that have taken over territory where the Kurds live. Over the past year, though, there's been a fourth rising faction: Islamic State of Iraq and the Levant (sometimes called ISIS, shown in blue), an extremist group based inIraqthat swears allegiance to al-Qaeda. They're fighting both the rebels and the government. So it's a three-way war now, as if it weren't already intractable enough.
Syria's refugee crisis
Syria's civil war hasn't just been a national catastrophe forSyria, but for neighboring countries as well. The war has displaced millions of Syrians into the rest of the Middle East and into parts ofEurope, where they live in vast refugee camps that are major drains on already-scarce national resources. This map shows the refugees; it does not show the additional 6.5 million Syrians displaced withinSyria. Their impact is especially felt inJordanandLebanon, which already have large Palestinian refugee populations; as many as one in five people in those countries is a refugee. While theUSand other countries have committed some aid for refugees, the United Nations says it's not nearly enough to provide them with basic essentials.
Iran
HowIran's borders changed in the early 1900s
Iranis the only Middle Eastern country was never conquered by a European power, but it came pretty close in the 1900s. It lost a lot of territory toRussia(the red stripey part). After that, the Russian Empire and British Empire (the British Indian Raj was just next door) dividedIran's north and south into "zones of influence." They weren't under direct control, but the Iranian government was bullied and its economy and resources exploited. This remains a point of major national resentment inIrantoday.
Iran's religious and ethnic diversity
Iranis most associated with the Persians — the largest ethnic group and the progenitors of the ancient Persian empires — but it's much more diverse than that. This map shows the larger minorities, which includes Arabs in the south, Kurds in the west, and Azeris in the north (Iranused to control all Azeri territory, but much of now belongs to the Azeri-majority countryAzerbaijan). The Baloch, in the southeast, are also a large minority group inPakistan. There is significant unrest and government oppression in the "Baluchistan" region of both countries.
Iran's nuclear sites and possible Israeli strike plans
This is a glimpse at two of the big, overlapping geopolitical issues in whichIranis currently embroiled. The first isIran's nuclear program: the country's leaders say the program is peaceful, but basically no one believes them, and the world is heavily sanctioningIran's economy to try to convince them to halt the nuclear development that sure looks like it's heading for an illegal weapons program. You can see the nuclear development sites on here: some are deep underground, while others were kept secret for years. That gets to the other thing on this map, which was originally built to show howIsraelcould hypothetically launch strikes againstIran's nuclear program. Israel-Iran tensions, which have edged near war in recent years, are one of the biggest and most potentially dangerous things happening right now in a part of the world that has plenty of danger already.Israelis worried thatIrancould build nukes to use against it;Iranmay be worried that it will forever be under threat of Israeli strike until it has a nuclear deterrent. That's called a security dilemma and it can get bad.
Afghanistan
How the colonial "Durand Line" set upAfghanistan's conflict
So, first ignore everything on this map except for the light-orange overlay. That shows the area where an ethnic group called the Pashtun lives. Now pretend it's the 1800s and you are a British colonial officer named Mortimer Durand, and it's your job to negotiate the border between the British Indian Raj and the quasi-independent nation ofAfghanistan. Do you draw the border right smack across the middle of the Pashtun areas, thus guaranteeing decades of conflict by forcing Pashtuns to be minorities in both states? If you answered "yes," then you would have made a great British colonial officer, because that's what happened. The "Durand Line," marked in red, became most of the border between modernAfghanistanandPakistan. Many Pashtun now belong to or support a mostly-Pashtun extremist group called the Taliban, which wreaks havoc in both countries and has major operating bases (shown in dark orange) in the Pakistani side of the border. Thanks, Mortimer!
The 1989 war that tore up Afghanistan
In 1979, the Soviet Union invadedAfghanistanto defend the pro-Moscow communist government from growing rebellions. TheUS(along withSaudi ArabiaandPakistan) funded and armed the rebels. The CIA deliberately chose to fund extremists, seeing them as better fighters. When the Soviets retreated in 1989, those rebel groups turned against one another, fighting a horrific civil war that you can see on this map: the red areas were, as of 1989, under government control. Every other color shows a rebel group's area of control. Some of these rebels, like the Hezb-i Islami Gulbuddin, are still fighting, though most of them were defeated when the Taliban rose up and conquered the country in the 1990s.
How the Taliban overlaps with ethnicity
This is to underscore the degree to whichAfghanistan's current war (the war that began when theUSand allies invaded in 2001, not the 1979 to 1989 war against the Soviets or the civil wars from 1989 to 2001) is and is not about ethnicity. The Taliban does very broadly, but not exclusively, overlap with the Pashtuns in the south and east. That's especially important since there are so many Pashtuns just across the border inPakistan, where the Taliban have major bases of operation. But there are rebel groups besides the Taliban, not all of which are Pashtun. Generally, though, the north of the country is stabler and less violent than the south or east.
The most important parts of the Afghan War, in one map
The Afghanistan War is extremely complicated, but this map does a remarkable job of capturing the most important components: 1) the Taliban areas, in orange overlay; 2) the areas controlled by the US and allies, in depressingly tiny spots of green; 3) the major Western military bases, marked with blue dots; 4) the areas of opium production, which are a big source of Taliban funding, in brown circles, with larger circles meaning more opium; 5) the supply lines through Pakistan, in red, which Pakistan has occasionally shut down and come under frequent Taliban attack; 6) the supply line through Russia, which requires Russian approval. If this map does not depress you about the prospects of the Afghan War, not much will.
Saudi Arabiaand Oil
WhatSaudi Arabiaand its neighbors looked like 100 years ago
TheArabian peninsulahas a very, very long history, and the Saudi family has controlled much of it since the 1700s. But to understand how the peninsula got to be what it is today, go back about a 100 years to 1905. The Saudis at that point controlled very little, having lost their territory in a series of wars. The peninsula was divided into lots of little kingdoms and emirates. The Ottoman Empire controlled most of them, with theBritish Empirecontrolling the southernmost third or so of the peninsula — that line across the middle shows how it was divided. After World War I collapsed theOttoman Empire, the Saudis expanded to all of the purple area marked here, as the British had promised for helping to fight the Ottomans. (This deal is dramatized in the film Lawrence of Arabia). By the early 1920s, the British effectively controlled almost all of the peninsula, which was divided into many dependencies, protectorates, and mandates. But the Saudis persisted.
Oil and Gas in theMiddle East
TheMiddle Eastproduces about a third of the world's oil and a tenth of its natural gas. (It has a third of all natural gas reserves, but they're tougher to transport.) Much of that is exported. That makes the entire world economy pretty reliant on the continued flow of that gas and oil, which just happens to go through a region that has seen an awful lot of conflict in the last few decades. This map shows where the reserves are and how they're transported overland; much of it also goes by sea through thePersian Gulf, a body of water that is also home to some of the largest reserves in the region and the world. The energy resources are heavily clustered in three neighboring countries that have historically hated one another:Iran,Iraq, andSaudi Arabia. The tension between those three is something that the United States, as a huge energy importer, has been deeply interested in for years: it sided against Iran during the Iran-Iraq war of the 1980s, against Iraq when it invaded Kuwait and threatened Saudi Arabia in the 1990s, again against Iraq with the 2003 invasion, and now is supporting Saudi Arabia in its rapidly worsening proxy war against Iran.
Oil, trade, and militarism in the Strait of Hormuz
The global economy depends on this narrow waterway betweenIranand theArabian Peninsula. Ever since President Jimmy Carter issued the 1980 "Carter Doctrine," which declared that theUSwould use military force to defend its access to Persian Gulf oil, the littleStrait of Hormuzat the Gulf's exit has been some of the most heavily militarized water on earth. TheUSinstalled a large naval force, first to protect oil exports from the brutal Iran-Iraq War of the 1980s, then to protect them from Saddam Hussein in the 1990s Gulf Wars, and now to protect them again fromIran, which has gestured toward shutting down oil should war break out againstIsraelor theUS. As long as the world runs on fossil fuels and there is tension in the Middle East, there will be military forces in theStrait of Hormuz.
WhyEgypt'sSuez Canalis so important for the world economy
TheSuez Canalchanged everything. WhenEgyptopened it in 1868, after ten years of work, the 100-mile, man-made waterway brought Europe andAsiadramatically and permanently closer. The canal's significance to the global order was so immediately obvious that, shortly after the British conqueredEgyptin the 1880s, the major world powers signed a treaty, which is still in force, declaring that the canal would forever be open to trade and warships of every nation, no matter what. Today, about eight percent of all global trade and three percent of global energy supply goes through the canal.
IraqandLibya
The ethnic cleansing of Baghdad during the Iraq War
There are few grimmer symbols for the devastation of the Iraq War than what it did toBaghdad's once-diverse neighborhoods. The map on the left shows the city's religious make-up in 2005. Mixed neighborhoods, then the norm, are in yellow. The map on right shows what it looked like by 2007, after two awful years of Sunni-Shia killing: bombings (shown with red dots), death squads, and militias. Coerced evictions and thousands of deaths effectively cleansed neighborhoods, to be mostly Shia (blue) or mostly Sunni (red). Since late 2012, the sectarian civil war has ramped back up, inBaghdadand nationwide.
Where the Kurds are and whatKurdistanmight look like
The ethnic group known as Kurds, who have long lived as a disadvantaged minority in several Middle Eastern countries, have been fighting for a nation of their own for a long time. This map shows where they live in green overlay, and the national borders that they have proposed on three separate occasions, all of them failed. The Kurds have fought many armed rebellions, including ongoing campaigns inSyriaandTurkey, and suffered many abuses, from attempted genocides to official bans on their language and culture. Their one major victory in the last century has been in Iraq: as a result of the US-led invasion that toppled Saddam Hussein, Iraqi Kurds have autonomous self-rule in Iraq's north.
A hypothetical re-drawing of Syria and Iraq
This is an old idea that gets new attention every few years, when violence between Sunnis and Shias reignites: should the arbitrary borders imposed by European powers be replaced with new borders along the region's ever-fractious religious divide? The idea is unworkable in reality and would probably just create new problems. But, in a sense, this is already what the region looks like. The Iraqi government controls the country's Shia-majority east, but Sunni Islamist extremists have seized much of westernIraqand easternSyria. The Shia-dominated Syrian government, meanwhile, mostly only controls the country's Shia- and Christian-heavy west. The Kurds, meanwhile, are legally autonomous inIraqand functionally so inSyria. This map, then, is not so much just idle speculation anymore; it's something that Iraqis and Syrians are creating themselves.
How Libya's 2011 War changed Africa
Noble as the cause was, the destruction of Moammar Qaddafi's dictatorship by a spontaneous uprising and a Western intervention has just wreaked havoc inAfrica's northern half. This map attempts to show all that came after Qaddafi's fall; that it is so overwhelmingly complex is precisely the point. The place to center your gaze is the patterned orange overlay acrossLibya,Algeria,Mali, andNiger: this shows where the Tuaregs, a semi-nomadic ethnic minority group, lives. Qaddafi usedLibya's oil wealth to train, arm, and fund large numbers of Tuaregs to fight the armed uprising in 2011. When he fell, the Tuaregs took the guns back out with them toAlgeriaandMali, where they took control of territory. InMali, they led a full-fledged rebellion that, for a time, seized the country's northern half. Al-Qaeda moved into the vacuum they left, conquering entire towns inMaliand seizing fossil fuel facilities inAlgeria. Criminal enterprises have flourished in this semi-arid belt of land known as theSahel. So have vast migration routes, of Africans looking to find work and a better life inEurope. At the same time, armed conflict is getting worse inNigeriaandSudan, both major oil producers. Qaddafi's fall was far from the sole cause of all of this, but it brought just the right combination of disorder, guns, and militias to make everything a lot worse.
Points of Light
Mapped by Internet connections (top) and by tweets (bottom)
These maps are two ways of looking at a similar thing: the digitalization of theMiddle East. The map on top is actually a population map: the dots represent clusters of people, but the dots are colored to show how many IP addresses there are, which basically means how many internet connections. The blue areas have lots of people but few connections: these are the poorer areas, such asYemen,Pakistan, andSyria. White and red show where there are lots of connections: rich countries likeIsraeland theUnited Arab Emirates, but also parts ofEgyptandIranandTurkey, the populations of which are increasingly wired, to tremendous political consequence. The map on the bottom shows tweets: lots of dots mean lots of tweets from that area. They're colored by language. Notice where these two maps are different:Iranhas lots of internet connections but almost no tweets; like Facebook, Twitter has been banned since the 2009 anti-government protests.Saudi Arabia, on the other hand, lights right up: its modestly sized population is remarkably wired. The significance of that became clear, for example, with the 2012 and 2013 social media-led campaigns by Saudi women to drive en masse, in protest of the country's ban on female drivers. The consequences of internet access and lack of access will surely continue to be important, and perhaps hard to predict, for the region.
TheMiddle Eastat night from space
I'm concluding with this map to look at the region without political borders, without demographic demarcations of religion or ethnicity, without markers of conflict or oil. Looking at the region at night, from space, lets those distinctions fall away, to see it purely by its geography and illuminated by the people who call it home. The lights trace the rivers that have been so important to the Middle East's history, and the world's: the Nile inEgypt, the Tigris and Euphrates that run throughIraqandSyria, the Indus inPakistan. They also show the large, and in many cases growing, communities along the shores of the Persian Gulf, the easternMediterranean, and the southern end of the Caspian. It's a beautiful view of a really beautiful part of the world.